Now in preview · macOS
Watch insight assemble.
Brightfield is a native macOS app that renders Mosaic specs and protocol graphs on your GPU — a single binary, no server, no webview, no account. It reports nothing: no telemetry, no analytics, no update check. Every bundled example draws with the network switched off.
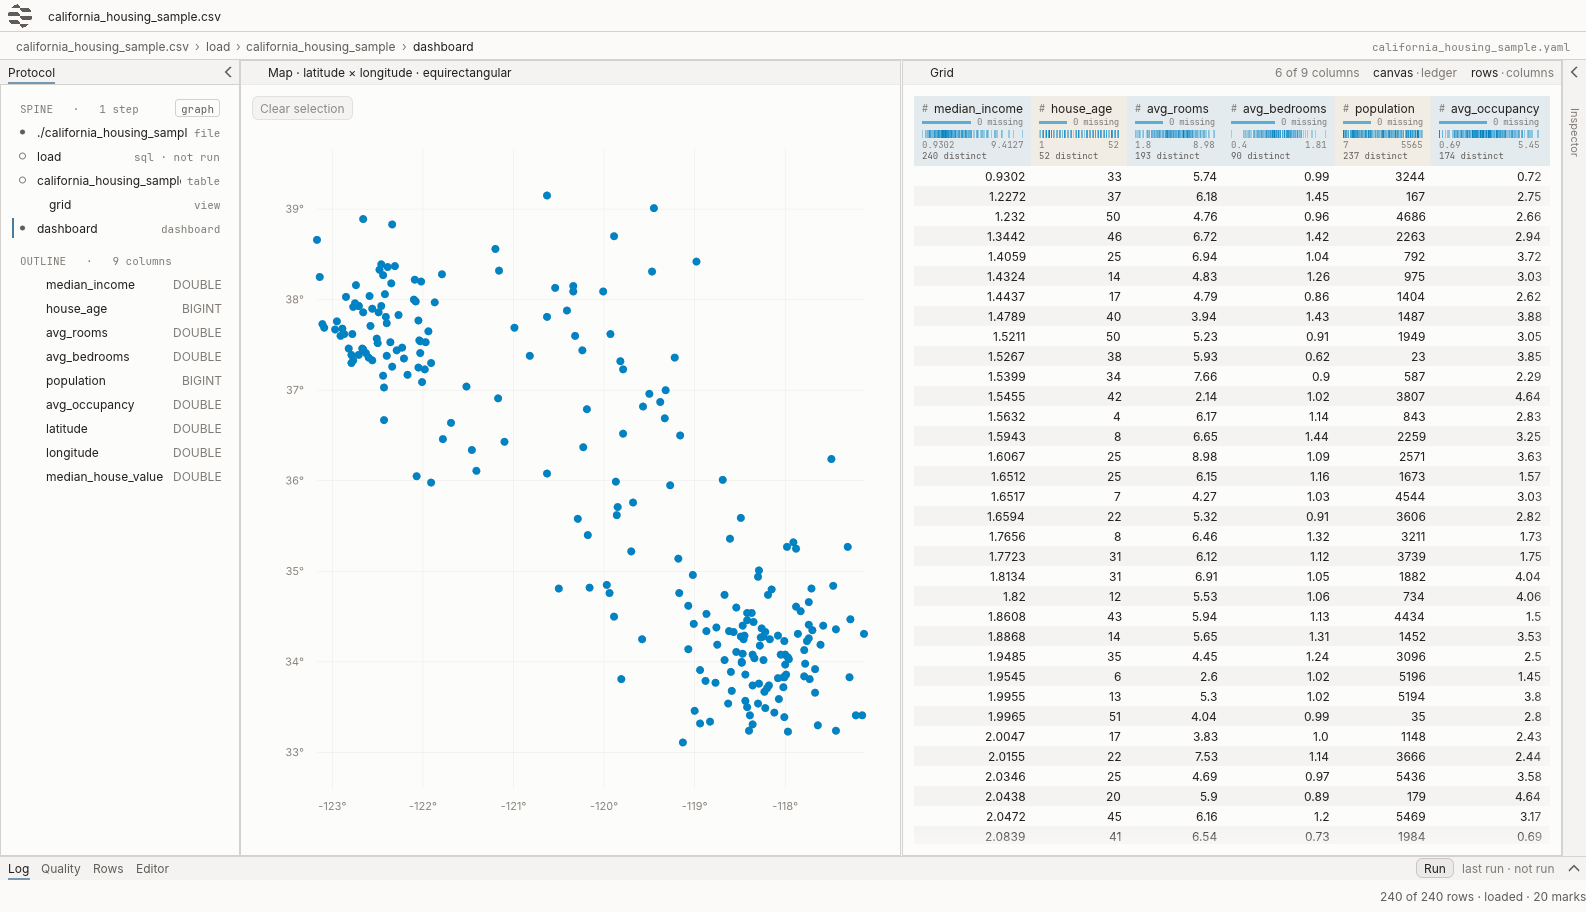
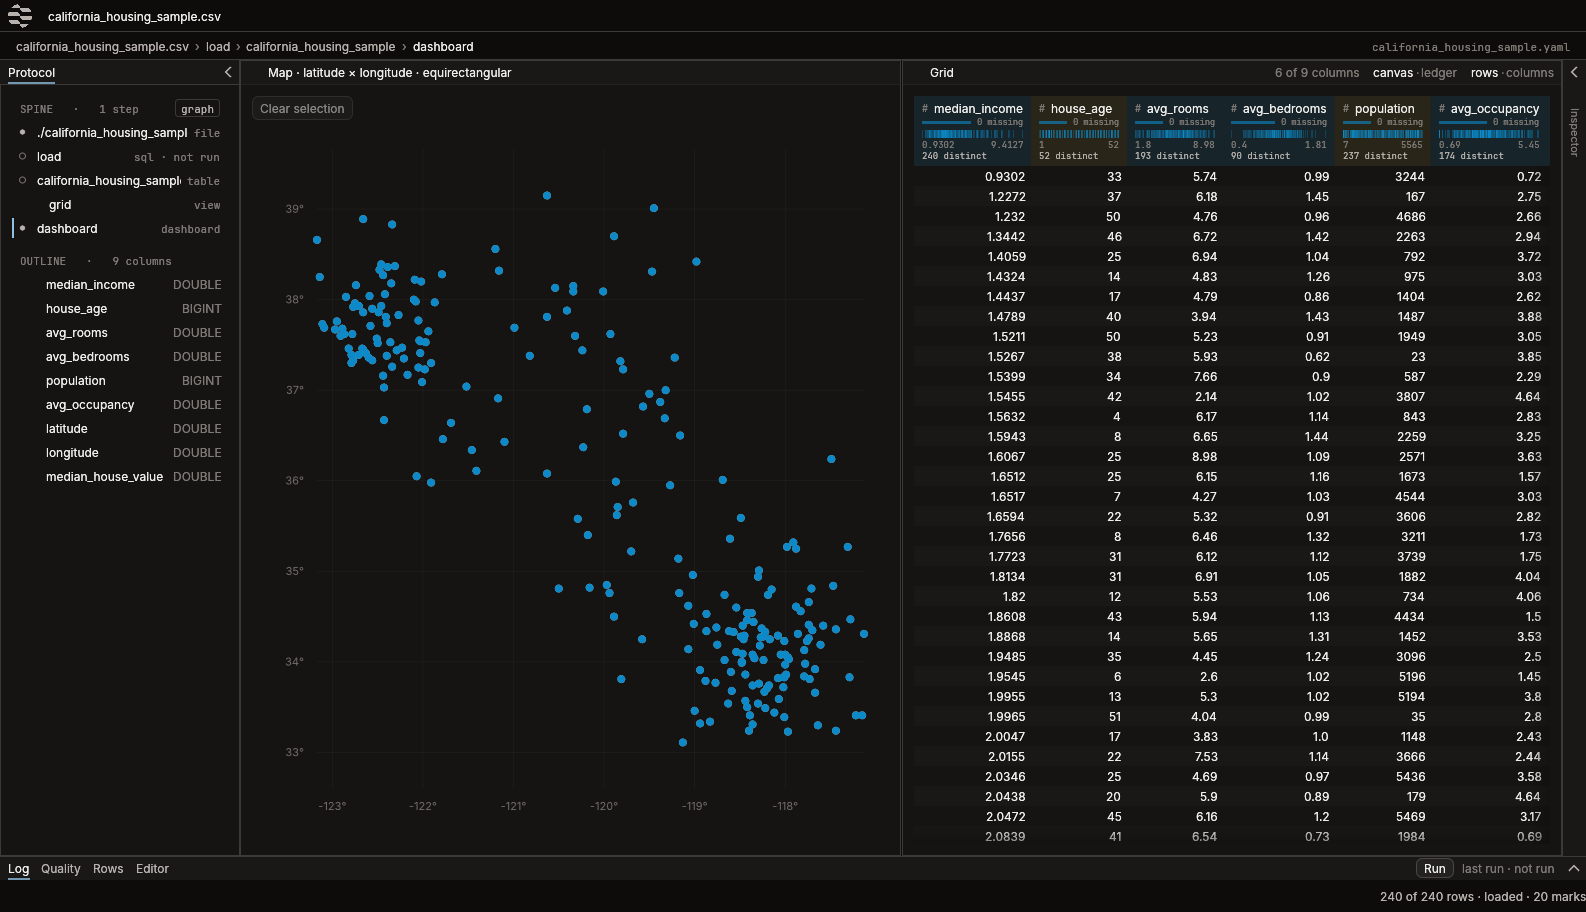
Brightfield opening a data file it has never seen, the California Housing sample, as a dashboard drawn from what each column's type earns.
curl -fsSL https://install.meridian.online/brightfield | bashbrew install meridian-online/tap/brightfieldmacOS only for now — Apple silicon and Intel.
What you get
Brightfield opens on a gallery of starts built around the EDGAR ↔ GLEIF crosswalk, so you have something to render the moment it launches. The crosswalk's protocol graph and a recorded run of it draw offline, and so does every bundled example. A start that fetches its data over the network says so on its card: the crosswalk chart reads the published crosswalk live. Open your own spec, or point it at a remote or DuckLake source when you want live data.
Not on macOS?
Linux: a Linux build is on the way. Windows: we're counting who wants it, and we can't promise one. Leave your email and we'll count you for the platform you're on.